
The Reports section breaks down every side of your studio's performance — sales, revenue, payroll, memberships, bookings, cancellations, courses, and merchandise. Each report is its own tab, and they all work the same way: filter to what you need, read the summary, and export.
Navigate to Reports.
- How every report works
- Sales · Revenue · Instructor Payroll · Memberships
- Booking · Cancellation · Courses · Merchandise
- Sales vs. Revenue — what's the difference?
How every report works
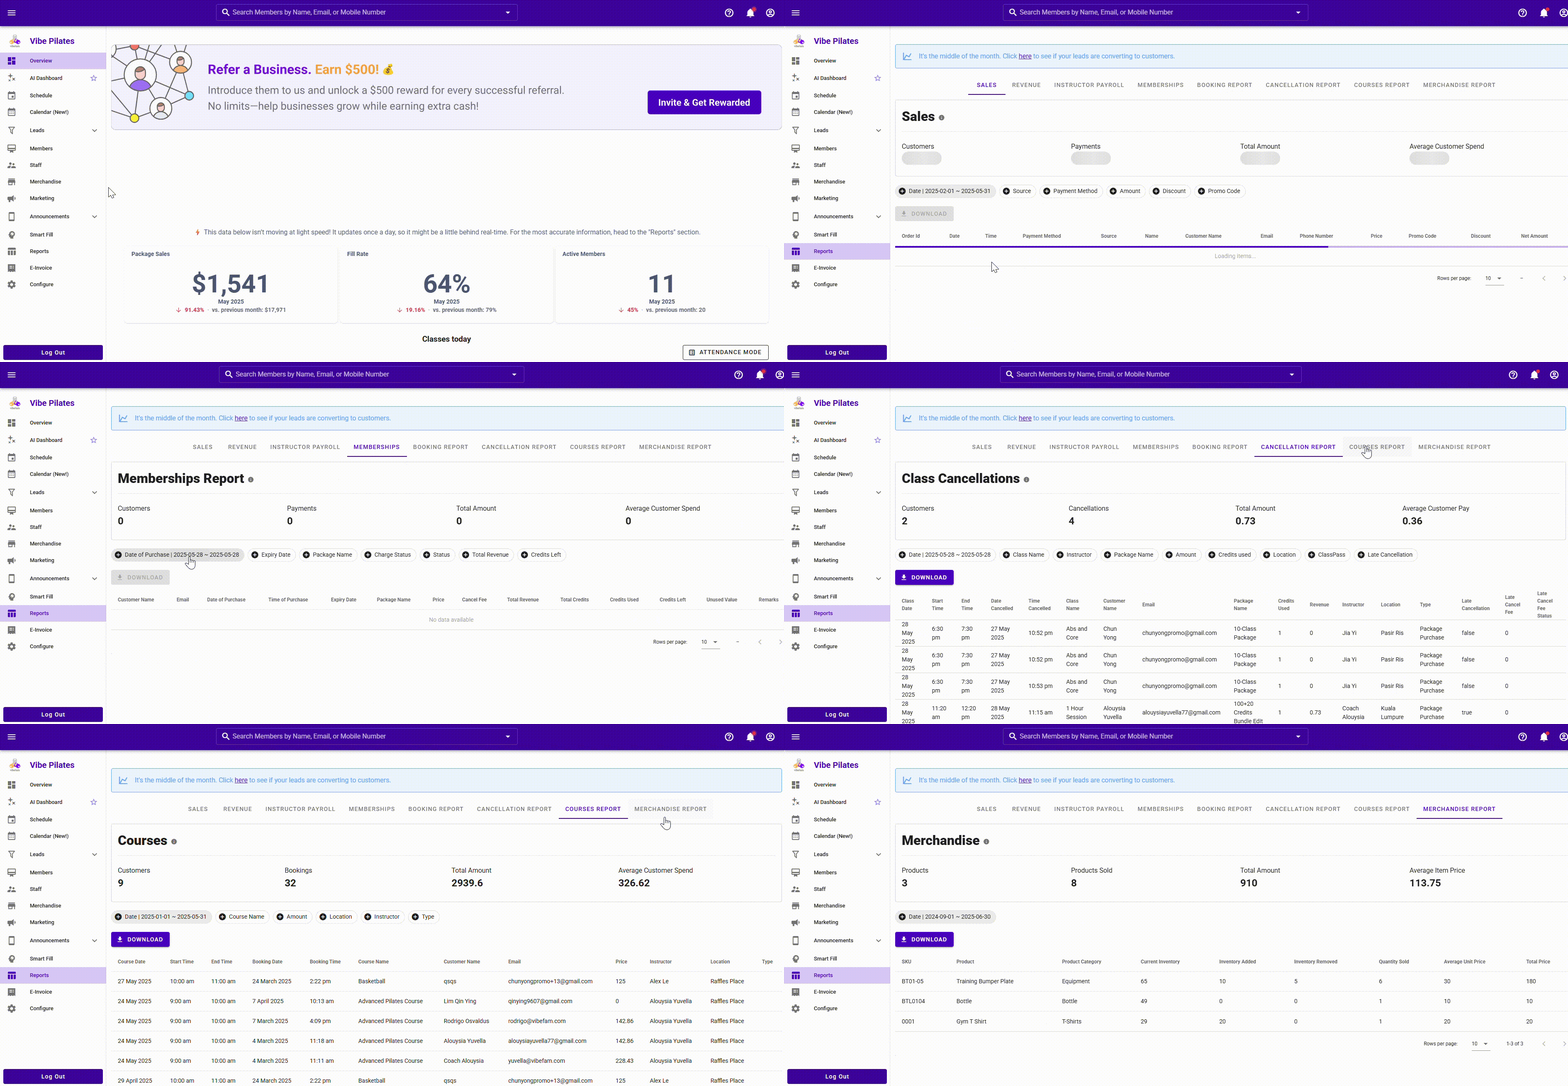
All reports share the same layout, so once you know one, you know them all:
- Summary cards across the top give you the headline numbers at a glance (e.g. Customers, Payments, Total Amount).
- A date filter sets the period. Most reports default to today — widen it to the range you want.
- Additional filters (Source, Location, Package Name, Amount, ClassPass, and others depending on the report) narrow the data. You only need to set the filters relevant to your question. Numeric filters like Amount or Pay let you choose Is Equal To, Is Between, Is Greater Than or Equal To, or Is Less Than or Equal To.
- Download exports the filtered report (as a CSV) for your own records or accounting.
- The data table lists every matching record, with pagination and adjustable rows per page.
Every report respects your filters when you export — so filter first, then Download to get exactly the slice you want.
The rest of this article covers what each report contains.
Sales
What it answers: how much money you collected, in total, across everything.
Sales is the total amount collected from all sources — memberships, courses, merchandise, and bookings.
- Summary: Customers, Payments, Total Amount, Average Customer Spend
- Filters: Date, Source, Payment Method, Location, Amount, Discount, Promo Code
- Source can be narrowed to Package Purchase, Recurring Package Purchase, Recurring Package Renewal, Course Purchase, Course Drop Ins, or Merchandise Sale
- Table includes: Order ID, Date, Source, Customer Name, Email, Phone Number, Location, Price, and more
Use it for a clean "how much came in" figure, and for reconciling by payment method or promo code.
Revenue
What it answers: where that money came from, broken down line by line.
Revenue is the itemised breakdown of all sales — the same money as the Sales report, but split across memberships, courses, merchandise, and bookings so you can see the composition.
- Summary: Customers, Records, Total Amount, Average Customer Revenue
- Filters: Date, Source, Package Name, Location, Amount, ClassPass
- Table includes: Source, Name, Date, Start/End Time, Customer Name, Email, Package Name, Location, plus ClassPass and Smart Fill flags
Use it to understand your revenue mix — which packages, classes, or products actually drive your income.
Instructor Payroll
What it answers: what each instructor should be paid, based on the payroll systems you've set up.
- Summary: Instructors, Classes, Total Pay, Average Instructor Pay
- Filters: Date, Percentage Fill, Number of Students, Number of Students Attended, Pay, Calculate Payroll By, Location, ClassPass
- Table includes: Date, Start/End Time, Class Name, Instructor, Class Capacity, Number of Students, Students Attended, ClassPass students, Pay, Late Cancellations
This report reflects the payroll structures configured per instructor. For how those are set up, see Add Staff → payroll. Filter by Percentage Fill or Students Attended to sanity-check pay against how full classes actually were.
Memberships
What it answers: a detailed breakdown of the packages and recurring packages sold to members.
- Summary: Customers, Payments, Total Amount, Average Customer Spend
- Filters: Date of Purchase, Expiry Date, Package Name, Charge Status, Location, Status, Total Revenue, Credits Left
- Charge Status can be narrowed to Charge Success, Charge Failed, Forgiven, or Refunded
- Table includes: Customer Name, Email, Expiry, Location, Package Name, Price, Cancel Fee, Total Revenue, Total Credits, Credits Used, Credits Left
Use Charge Status → Charge Failed to chase recurring payments that didn't go through, and Credits Left with an upcoming Expiry Date to spot members you could nudge to rebook.
Booking
What it answers: every class booking your members made.
- Summary: Customers, Bookings, Total Revenue, Average Customer Spend
- Filters: Date, Class Name, Instructor, Package Name, Amount, Credits used, Location, ClassPass
- Table includes: Class Date, Start/End Time, Date Booked, Time Booked, Class Name, Customer Name, Email, Package Name, Credits Used, Revenue, Instructor, Location
Use it to see attendance patterns, which classes fill, and how bookings map to credits and revenue.
Cancellation
What it answers: every class cancellation, and any fees attached.
- Summary: Customers, Cancellations, Total Amount, Average Customer Pay
- Filters: Date, Class Name, Instructor, Package Name, Amount, Credits used, Location, ClassPass, Late Cancellation
- ClassPass can be narrowed to Booked on ClassPass or Not booked on ClassPass
- Table includes: Class Date, Start/End Time, Date Cancelled, Time Cancelled, Class Name, Customer Name, Email, Package Name, Credits Used, Late Cancellation, Late Cancellation Fee
Use the Late Cancellation filter to review where fees applied, and to spot classes or members with high cancellation rates.
Courses
What it answers: all course sales, including course offerings, drop-ins, and replacements.
Only relevant if you have courses scheduled.
- Summary: Customers, Bookings, Total Amount, Average Customer Spend
- Filters: Date, Course Name, Amount, Location, Instructor, Type
- Table includes: Course Date, Start/End Time, Booking Date, Booking Time, Customer Name, Email, Price, Instructor, Location, Type
Use the Type filter to separate full course purchases from drop-ins.
Merchandise
What it answers: merchandise sales and stock movement.
- Summary: Products, Products Sold, Total Amount, Average Item Price
- Filters: Date
- Table includes: SKU, Product, Product Category, Current Inventory, Inventory Added, Inventory Removed, Quantity Sold, Average Unit Price, Total Price
Beyond sales, this doubles as a light stock report — Current Inventory alongside Quantity Sold shows you what's moving and what's running low.
Sales vs. Revenue — what's the difference?
These two are easy to confuse:
- Sales = the total money collected, as payments. One clean top-line figure.
- Revenue = the same money, itemised by what it was for (which package, class, course, or product).
If you want "how much did we take this month?", use Sales. If you want "what did that money come from?", use Revenue.
Tips
- Set the date range first — most reports default to today, which is why a report can look empty when you first open it.
- Download after filtering, not before — the export matches whatever filters are applied.
- Match the report to the question: payroll for instructor pay, Memberships → Charge Failed for payment recovery, Cancellation → Late Cancellation for fee review, Merchandise for stock.